
A new analysis of high school completion from the 91��Ƭ����Ƶ Research Center finds that the graduation rate for America’s public schools stands at 73.4 percent for the class of 2009, the most recent year for which data are available. The graduation rate, which has risen 1.7 percentage points from the previous year and more than 7 percentage points in the past decade, has reached its highest point since the late 1970s. These results also mark a second consecutive year of solid improvements, following a period of declines and stagnation.
The EPE Research Center calculates graduation rates for the nation, states, and every public school district in the country using the Cumulative Promotion Index (CPI) method and data from the U.S. Department of 91��Ƭ����Ƶ’s Common Core of Data.
While such signs of progress are reason for encouragement, that optimism is tempered by the reality that far too many young people are still failing to complete a high school education. We project that 1.1 million students from this year’s high school class will not graduate with a diploma. That amounts to 6,000 students lost each school day, or one student every 29 seconds.
A Rising Tide for Some Boats
In recent years, graduation trends for the nation as a whole have been consistently mirrored across major racial and ethnic categories, with all groups moving upward or downward together, albeit at varying rates. But, looking beneath the surface of the overall gain posted for the class of 2009, we do not find the expected across-the-board pattern of improvements.
Graduation rates for Asian-American and Native American students in the class of 2009 dropped, by 2 percentage points and one point, respectively. These declines, however, were more than offset by a moderate increase of 1.7 percentage points among African-Americans and an impressive rise of more than 5 points for Latino students. The graduation rates for those two groups have seen solid improvement over the past three years.
| Data Download | ||||
|---|---|---|---|---|
|
Among the implications of these diverging trajectories is a continued narrowing of the graduation gaps between whites and their African-American and Latino peers. The black-white graduation gap has been reduced by one-fifth since 2000, with the Latino-white gap shrinking by more than one-quarter. While students from all historically underserved racial and ethnic groups are earning diplomas at higher rates than they did a decade ago, striking disparities remain.
Gaps Persist
The nation’s graduation rate continued to climb for the second year in a row and stands at its highest point in more than two decades. Solid improvements posted by black and Latino students for the class of 2009 more than offset modest year-over-year declines for Asian, American Indian, and white students.

SOURCE: EPE Research Center, 2012
Sixty-three percent of Latino students in the class of 2009 graduated, as did 59 percent of African-Americans and 53 percent of Native Americans. Whites and Asian-Americans, the highest-performing groups, graduated at rates of 79 and 81 percent, respectively. Nationwide, 70 percent of male students and 76 percent of female students earned diplomas, a gender gap of nearly 7 percentage points that has remained virtually unchanged for years. High school completion rates for minority males consistently fall between 50 and 60 percent.
Similar—if not more dramatic—divides are found between the highest- and lowest-performing states. At the extremes, a 35-percentage-point gap separates New Jersey (graduating 87 percent of students) from the District of Columbia (52 percent). Other national leaders graduating more than 80 percent of their public high school students include: Iowa, Minnesota, North Dakota, Pennsylvania, and Wisconsin. Overall, graduation rates in half the states fall within 4 points of the national average of more than 73 percent.
Rates of graduation have also risen in a large majority of states during the past decade. Forty-four states have posted gains ranging from a fraction of a percentage point to 24 points over that period. Among the states that have lost ground, about half saw declines of less than 5 percentage points.
Focus on One Population
Nongraduates By Race and Ethnicity
Latinos More Than One-Quarter of Nation’s 1.1 Million Nongraduates
The EPE Research Center projected the number of graduates and nongraduates for the class of 2012 by multiplying the 2008-09 graduation rate by the number of 9th graders enrolled that year.
Nationally, 1.1 million members of this year’s graduating class will not earn diplomas. Members of historically disadvantaged minority groups constitute a disproportionate share of dropouts. Latinos, for example, make up 21 percent of the student population but 27 percent of nongraduates.

Dropout Epicenters
Twenty-five school districts account for 37 percent of the nation’s Latino nongraduates for the class of 2012.

Latino-Serving Districts Exceeding Expectations
For this report, the EPE Research Center identified the nation’s largest predominantly Latino school systems: 134 districts with enrollments of at least 10,000 and a majority-Latino student population. An original analysis conducted by the center found that 38 of these school systems posted Latino graduation rates higher than would be expected based on a detailed profile of 10 key characteristics, including district size, poverty rate, and levels of racial and socioeconomic segregation.

District Context
The EPE Research Center analyzed key features of the school systems attended by the typical Latino student and compared those results with the district context for the typical white student. Relative to whites, Latinos are much more likely to attend large districts in urban environments that are characterized by high levels of poverty and segregation.

Regional Patterns
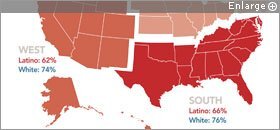
For white students and the U.S. population as a whole, high school graduation rates are highest in the Northeast, the region where the nation’s largest racial and ethnic gaps are generally found. Latinos, by contrast, graduate at the highest rates in the South, where they lag behind their white peers by 10 percentage points.
Graduation in the 50 Largest Districts
Among the nation’s largest public school systems, a group of perennially strong performers tops the rankings for the class of 2009. Graduation rates exceed 80 percent in Maryland’s Montgomery and Baltimore counties, as well as Fairfax County, Va., and Jefferson County, Colo.

SOURCE: EPE Research Center, 2012
Because graduation rates for Latinos lag substantially behind the U.S. average, this group makes up a disproportionate number of the students who do not finish high school. Of the 1.1 million members of the class of 2012 that we project will fail to graduate with a diploma, about 310,000 (or 27 percent) will be Latinos. Two states—California and Texas—will produce half the nation’s Latino dropouts.
The challenges faced by Latino students are largely reflected in—if not directly driven by—the characteristics of the communities in which they live and the school systems by which they are served. Latinos are much more likely than whites to attend districts that are large and highly urbanized, that serve high proportions of English-language learners, and that struggle with high levels of poverty and racial and socioeconomic segregation. Each of these factors has consistently been linked to significantly lower graduation rates.
Since 2009, Diplomas Count has featured a special annual investigation of district performance that seeks to identify school systems that are “overachieving” or beating the odds—that is, producing graduation rates higher than would be expected, based on a detailed profile comprised of 10 distinct characteristics, including size, location, poverty level, and structural features. This analysis attempts to move beyond conventional points of comparison, such as national or state averages, and gauge a district’s performance against other similarly situated systems.
This year, the EPE Research Center directed its attention to Latino graduation rates in school systems serving large Latino populations. Specifically, we identified a nationwide group of 134 majority-Latino districts with enrollments of at least 10,000 students. Although these systems are spread across 14 different states, most are concentrated in California, Texas, and a handful of other states with large Latino populations.
From this focal group, we identified 38 districts where graduation rates for Latinos exceeded expectations, by margins ranging from 1 percentage point to 22 points. Topping the list is California’s Lompoc Unified School District, which graduated 89 percent of its Latino students, compared with an expected rate of 67 percent. Three other districts “overachieved” by at least 15 percentage points: the Ceres Unified and Merced Union districts in California and Arizona’s Yuma Union High School District. High-performing systems outside the West and Southwest included those serving Providence, R.I., and Yonkers, N.Y.
Progress on Policy
Every year, Diplomas Count assesses the status of state policies that may affect high school graduation rates and students’ readiness to pursue college or a career upon earning a diploma. An original survey of the 50 states and the District of Columbia conducted by the EPE Research Center tracks activity on 18 policy indicators in three broad areas: college- and work-readiness definitions, high school completion credentials, and high school exit exams.
Thirty-seven states have college-readiness definitions in place in 2012, four more states than last year and 26 more than in 2007, when the center first started tracking activity in this area. These state policies outline the skills and knowledge needed to succeed in entry-level college courses. Thirty-seven states have also established similar frameworks for work readiness. Although the pace of adoption has slowed, states continue to make headway on college- and work-readiness expectations, often in the context of implementing policies and programs linked to the Common Core State Standards.
Twenty-three states offer the opportunity for students in the class of 2012 to earn advanced diplomas or recognitions for exceeding the basic expectations for graduation; alternative certificates are an option for those who do not complete standard requirements in 26 states. However, in what may be an emerging trend, states have scaled back on the variety of credentials offered to high school completers. Eighteen states—five more than last year—report offering only a standard high school diploma for 2012.


